· knowledge · 5 min read
Understanding complex data relations using graphs
How graph theory can be leveraged to better understand complex data landscapes

One of wayfare.ai’s core values is to help companies create data pipelines in very complex data landscapes.
As companies grow, databases tend to grow beyond intended, documentation becomes outdated, and the overview of data relations and dependencies is lost. At some point it can become practically unfeasible to understand and untangle the data manually. This makes it very difficult to interact, sync and migrate data.
In this blog, we will describe how graphs can be utilized to provide insights of data relations, which enables us to understand and untangle large and complicated data landscapes.
Why is this relevant?
There are several use cases, where using graph algorithms gives us an advantage when building data pipelines in complex environments. We will dive into a few examples.
Example 1: Moving a subset of tables from a complex database
Before setting up a data pipeline flow from a source, it is paramount to have an in-depth understanding of the source data and its relations.
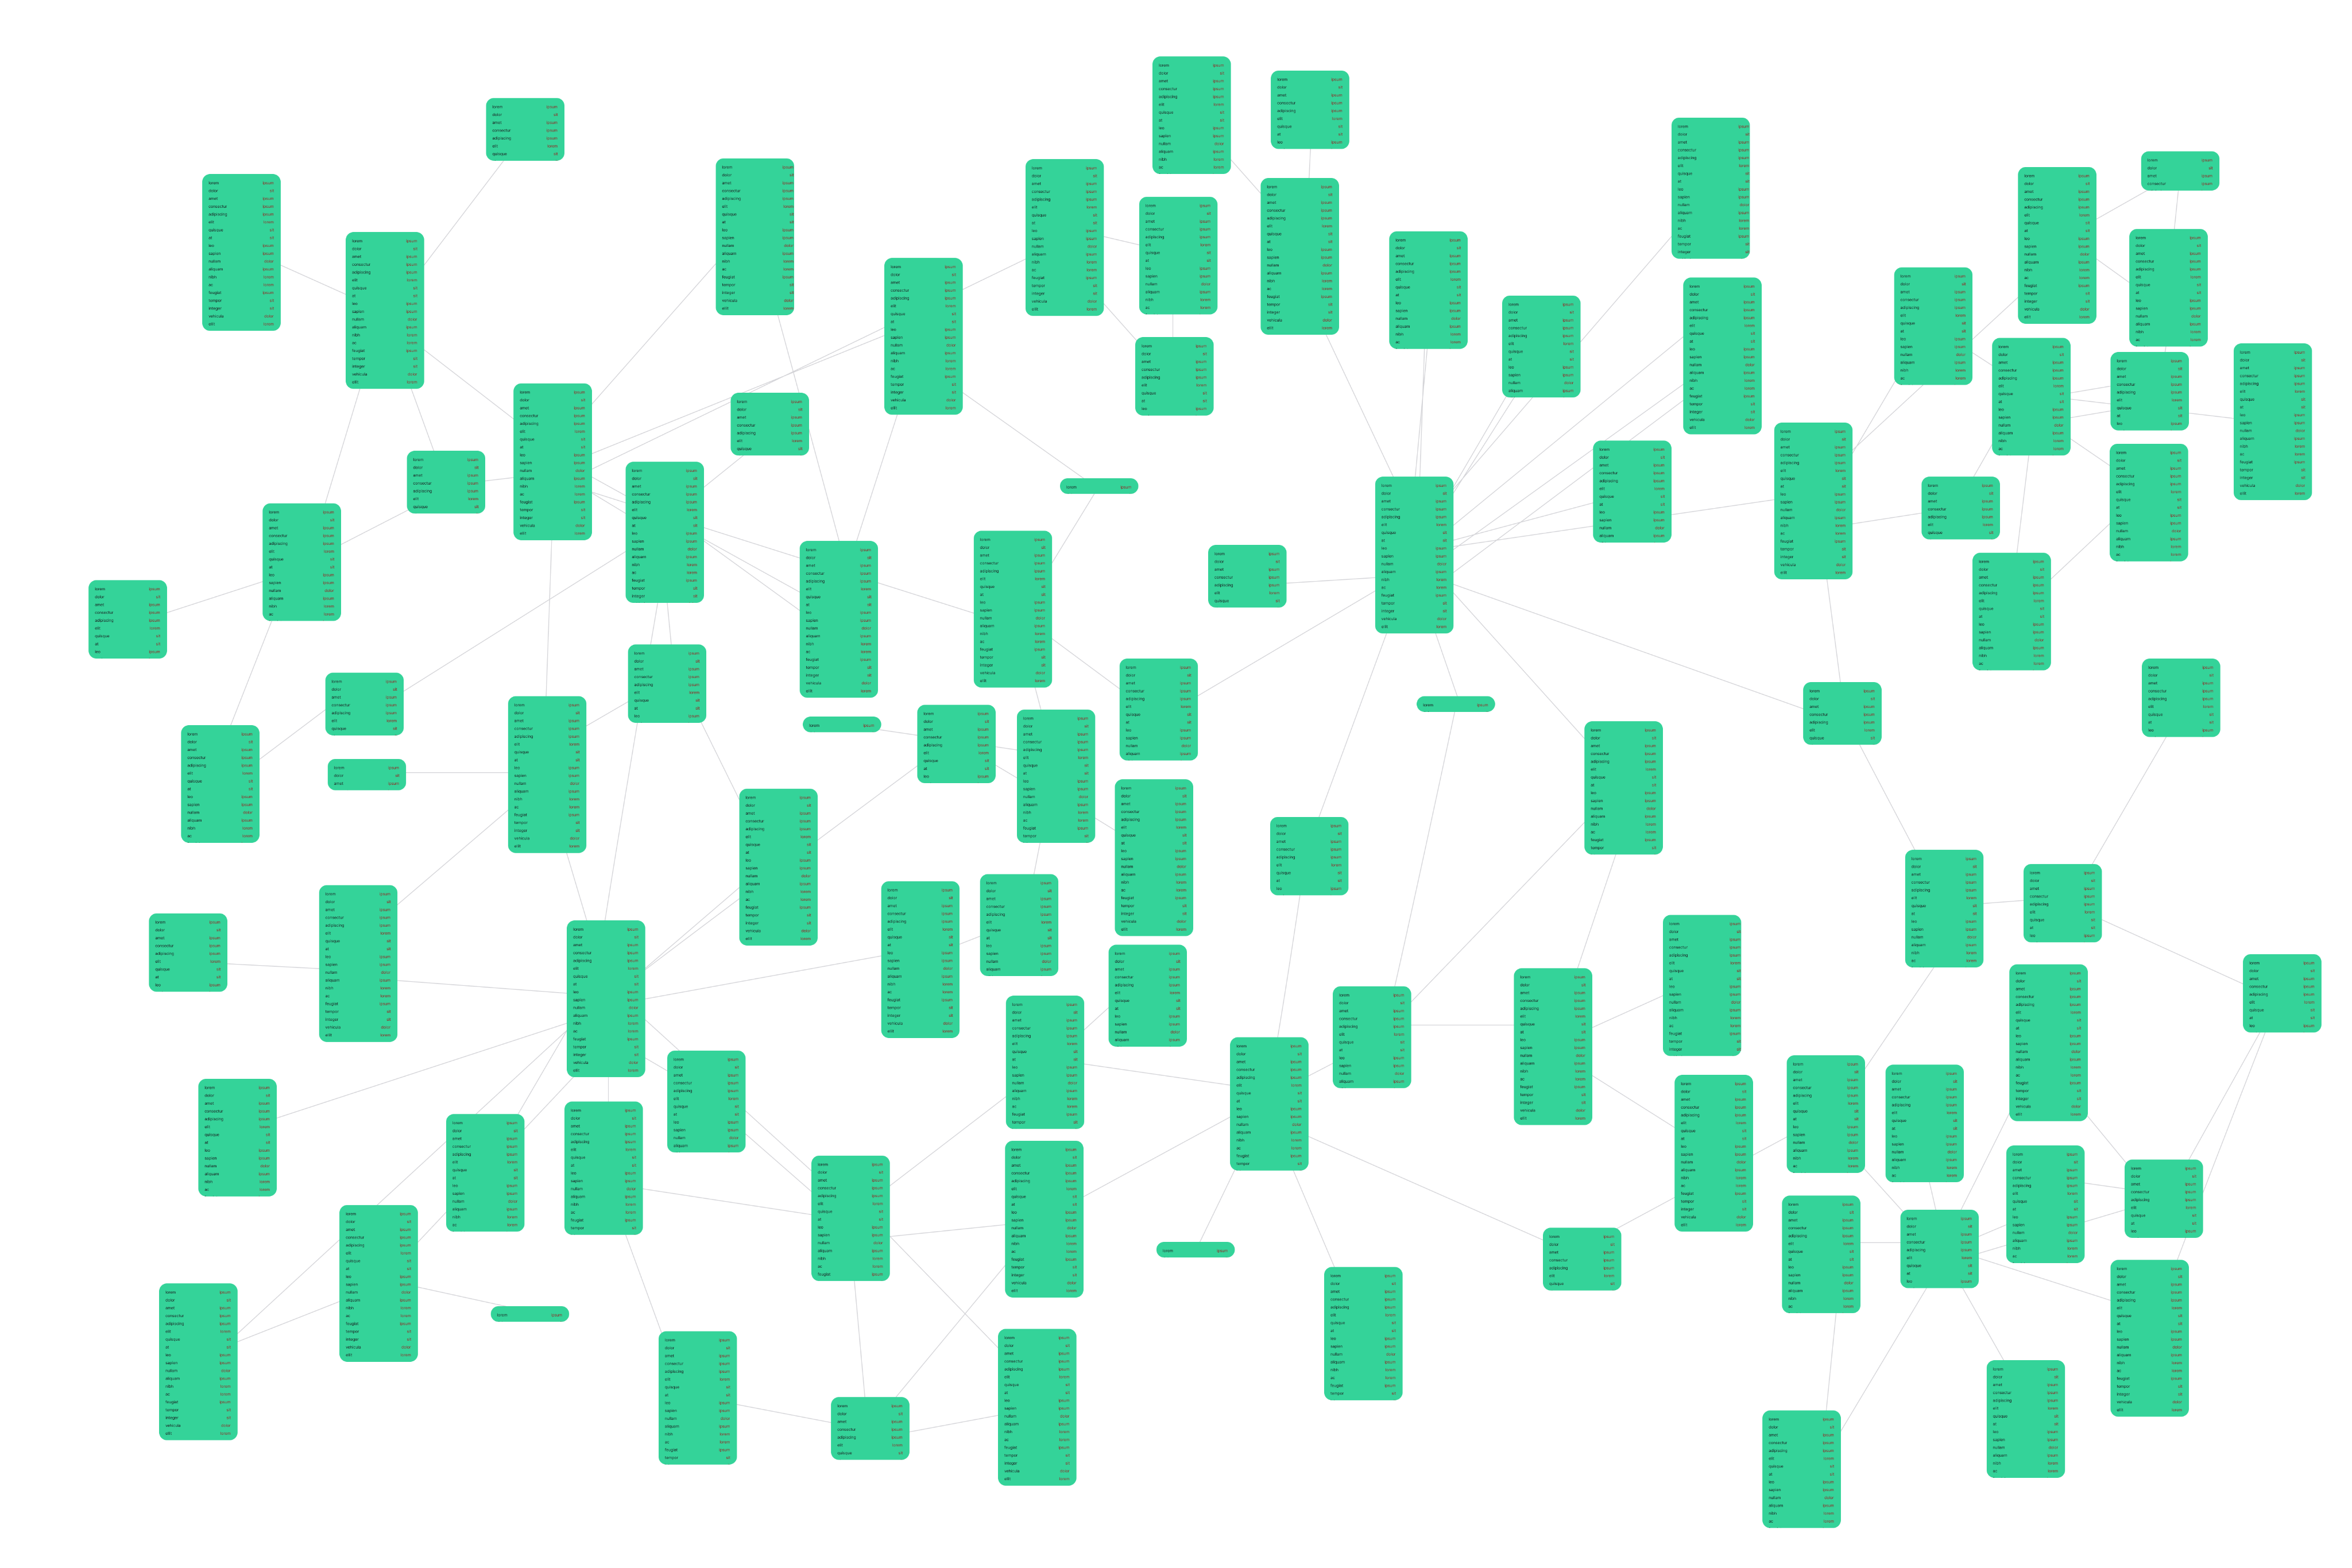
In our past, we have often had the very unpleasent task of being asked to set up data pipelines, where the source is a large complex database with hundreds of tables, sometimes thousands of relations, outdated documentation and no support. Before setting up a pipeline from these sources to a target database or warehouse, we have had to get an in-depth understanding of these source databases. The ER diagrams are too large to give any value with that amount of tables, and we have had to develop tools to reverse engineer the source database before setting up the pipelines.
Now suppose we want to setup a data pipeline from an SQL database of this kind into a data warehouse, and we only want to select a subset of the tables in the database. These tables have multiple foreign keys linking to other tables. It’s important, that we include these as well (and also the tables that the linked tables links to etc.), as we will otherwise end up trying to create tables in the destination with fields linking to non-existing tables.
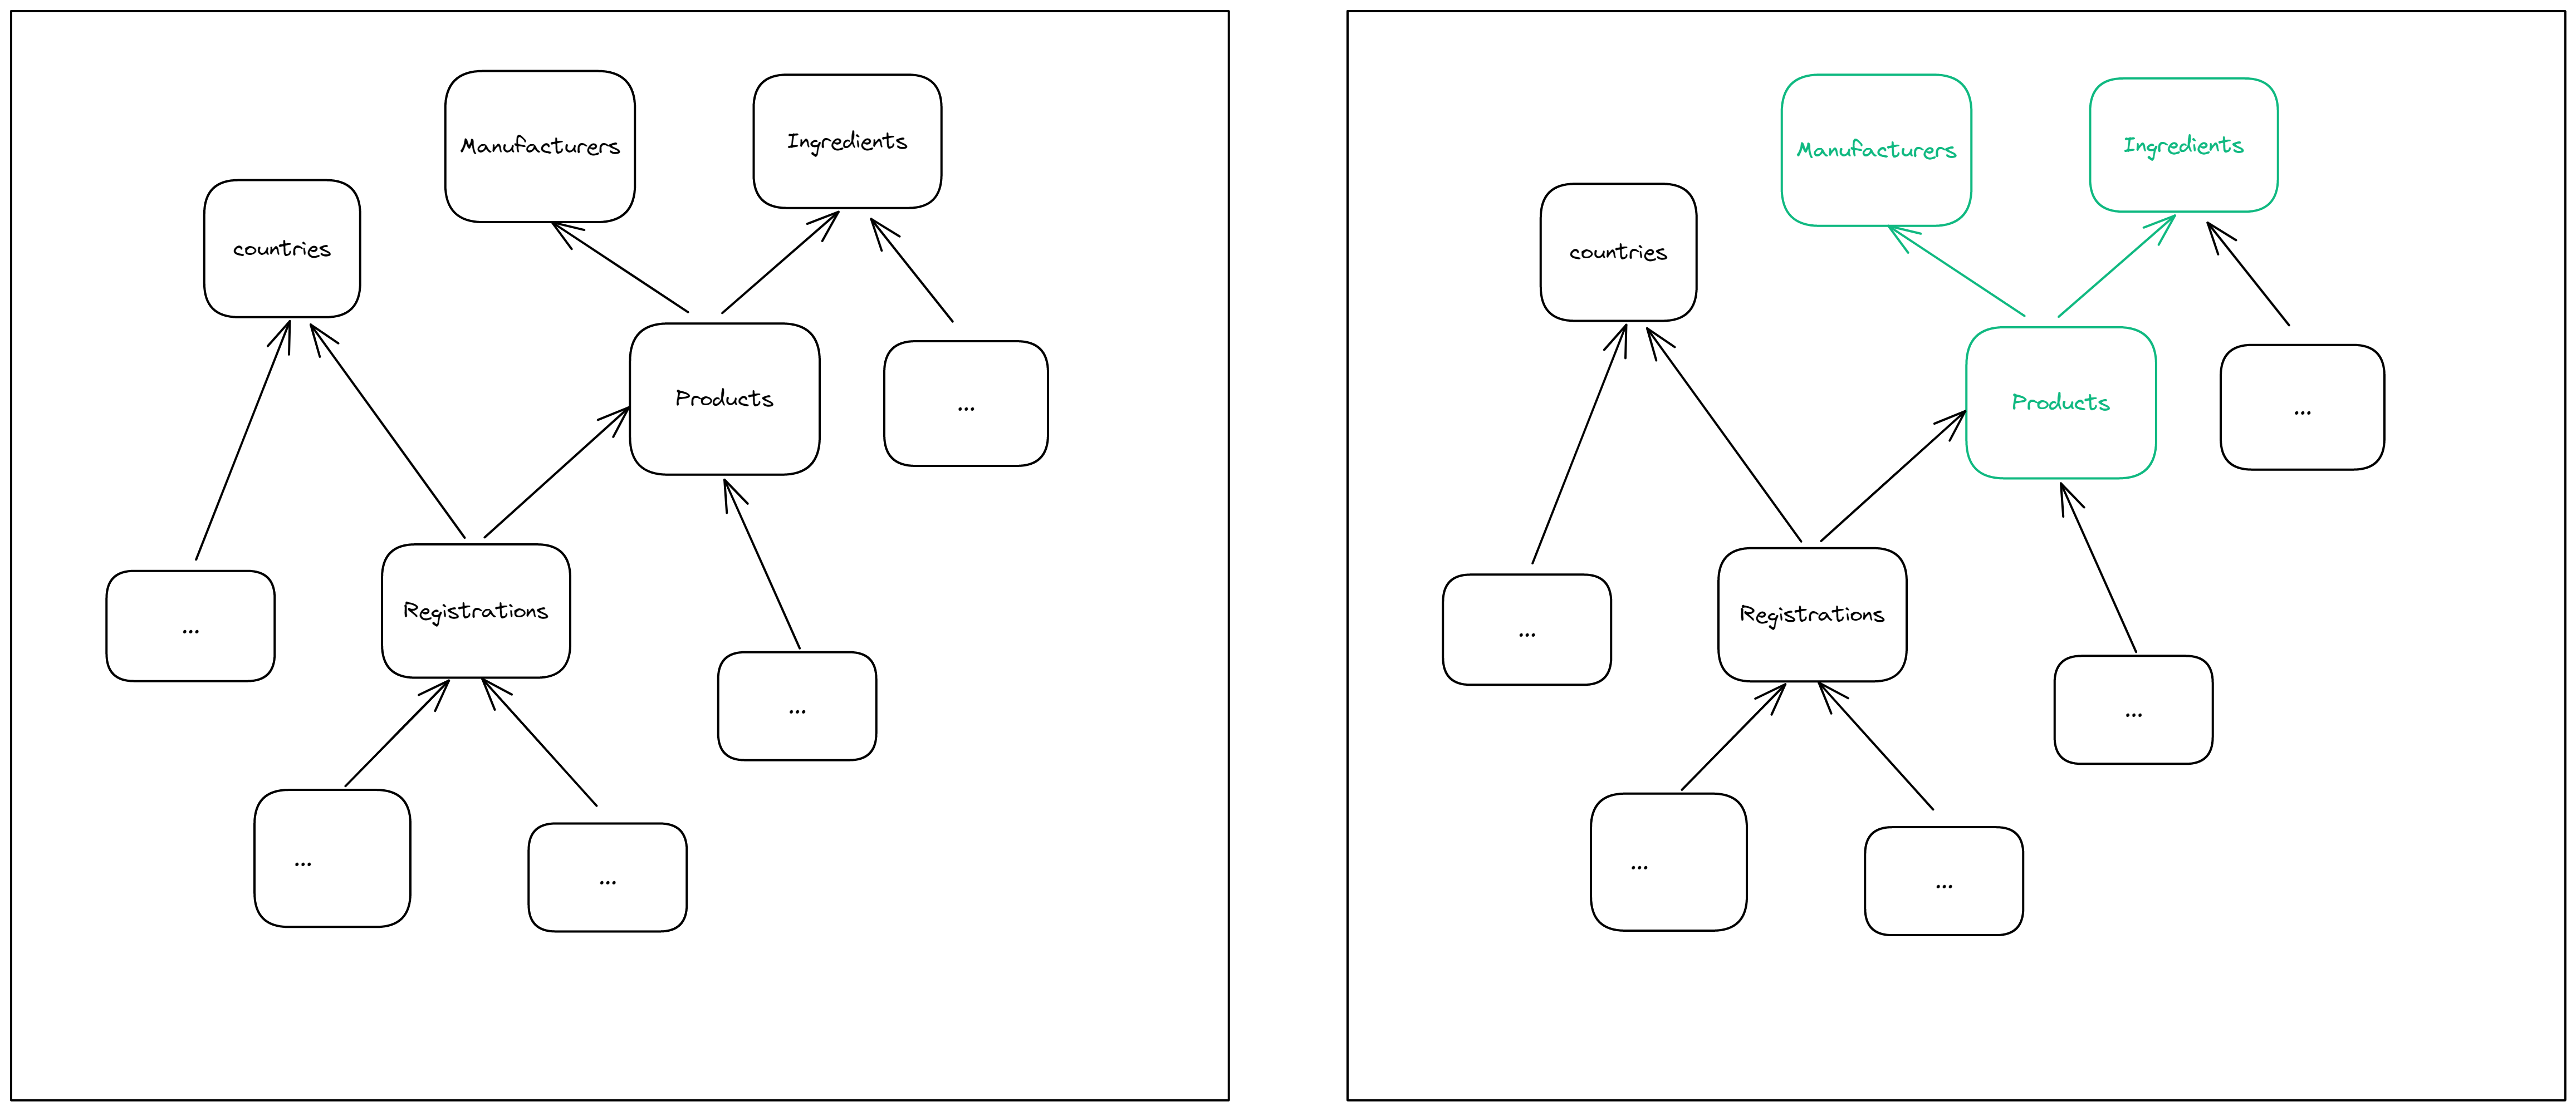
Take as an example a database with a table of products owned by a phamaceutical company. Every product has a manufacturer and contains one or more active ingredients (see the Figure below). If we were to move the product table without including the manufacturer and ingredients, we will end up with products in the destination that contained links to non-existing manufacturers or ingredients.
Therefore we need include all descendants in the ER diagram of the tables we wish to migrate in order to understand what tables are required.
This can be solved with simple graph algorithm. A Python example of finding the descendants of the Product table in a postgres SQL database can be seen below (using the Networkx package to get the descendants).
import networkx as nx
from sqlalchemy_schemadisplay import create_schema_graph
from sqlalchemy import MetaData
from sqlalchemy import create_engine

# Connect to Postgres database
engine = create_engine(
    'postgresql+psycopg2://user:pwd@host:port/database'
)
engine.connect()

# Create the ER diagram for the schema and convert to Networkx
pydot_graph = create_schema_graph(
    metadata=MetaData(
        engine,
        schema='schema'
    )
)
nx_graph = nx.nx_pydot.from_pydot(pydot_graph)

# Find the descendants of the Products table
nx.descendants(nx_graph, 'Products')
This gives the tables which Products depend on as output
{'Manufacturers', 'Ingredients'}
Example 2: Reverse ETL into Salesforce
When syncing into a system like Salesforce, the order of the tables and rows in the sync is important.
An example is when creating territories in the Territory Model. Here, territories can point to other territories, and there is a hierarichal structure within the records in this table.
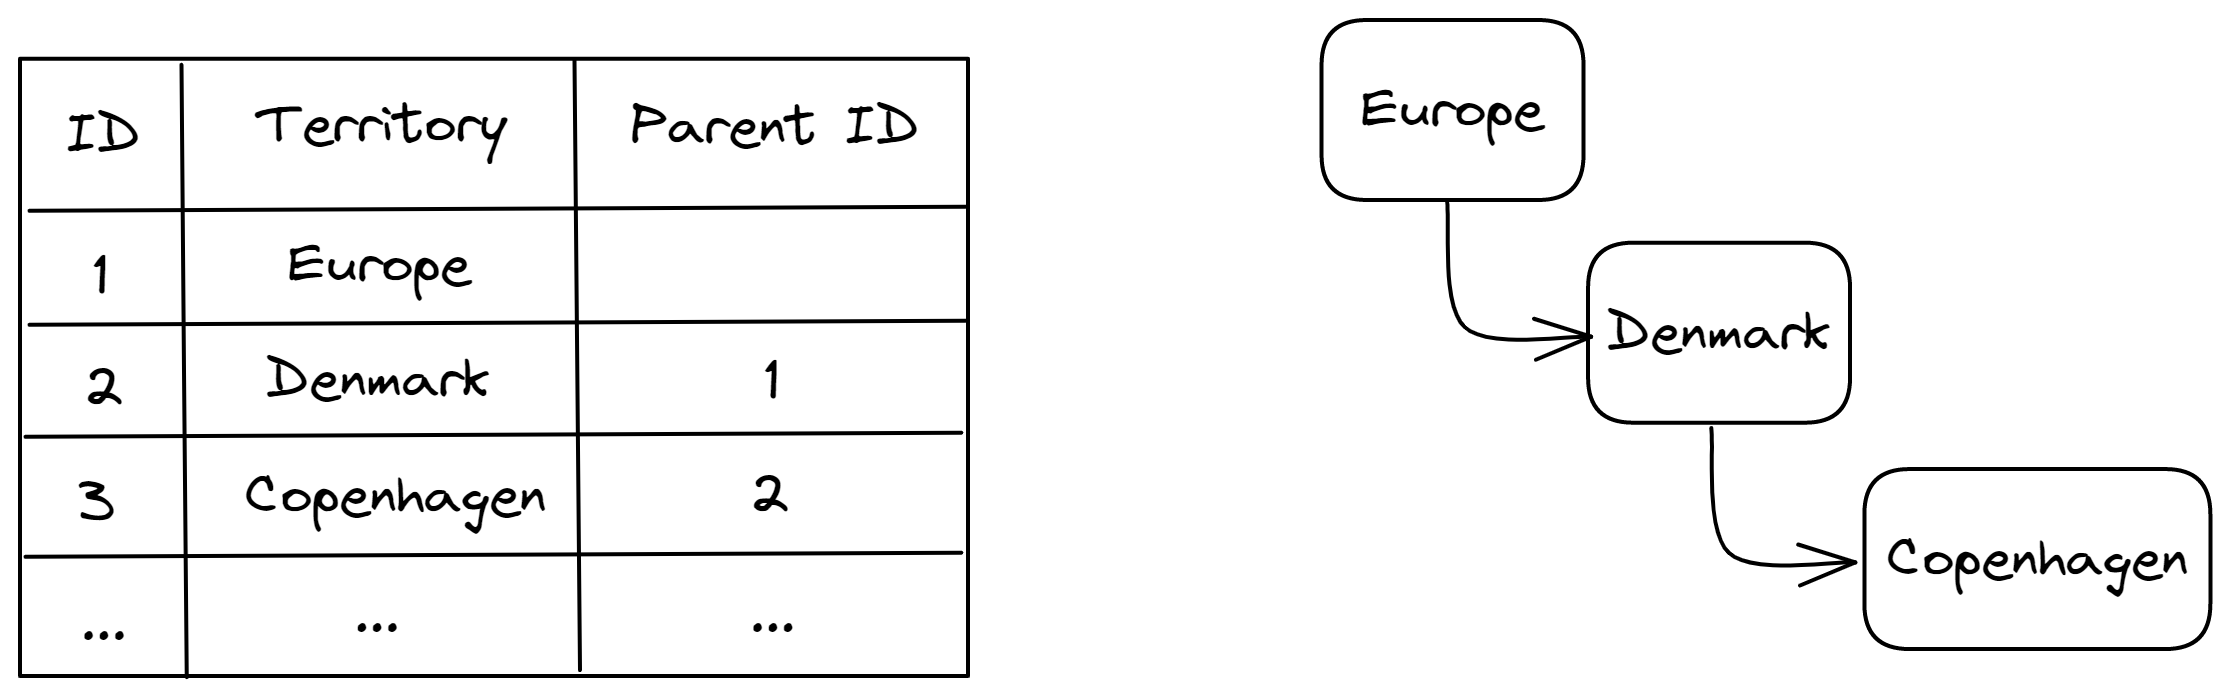
In the example above, we naturally need to create Denmark before creating Copenhagen, as the territory Copenhagen relates to Denmark. Here we can create the ancestor graph of the hierarichal model and use that to automatically determine the order of the records in the sync.
Example 3: Data lineage
Another useful application is to store the data lineage of the pipelines in a graph, as this will allow for fast and scalable querying. In that way it’s possible to quickly provide overview of ancestors and descendants of datafields.

This has multiple valuable use cases, for example:
- Understanding the source origin of a specific dataset field
- Quickly getting an overview of where certain fields containing GDPR data is used
More Advanced Graph algorithms
Sometimes more advanced techniques are nessecary. Suppose we want to set up a data pipeline, where we in a transformation step in our data warehouse, wants to join multiple tables that are very far from each other in the ER diagram. It might be difficult to figure our how these should be joined. Here it may be useful to utlize more advanced graph algorithms like Steiner tree to understand how they should be joined. This unfortunately can’t be used blindfolded, as the desired tables and types of joins are very dependent on the data we wish to end up with, so we recommend only using these algorithms in exploratory phases of very large databases and not in a fully automatic implementation.
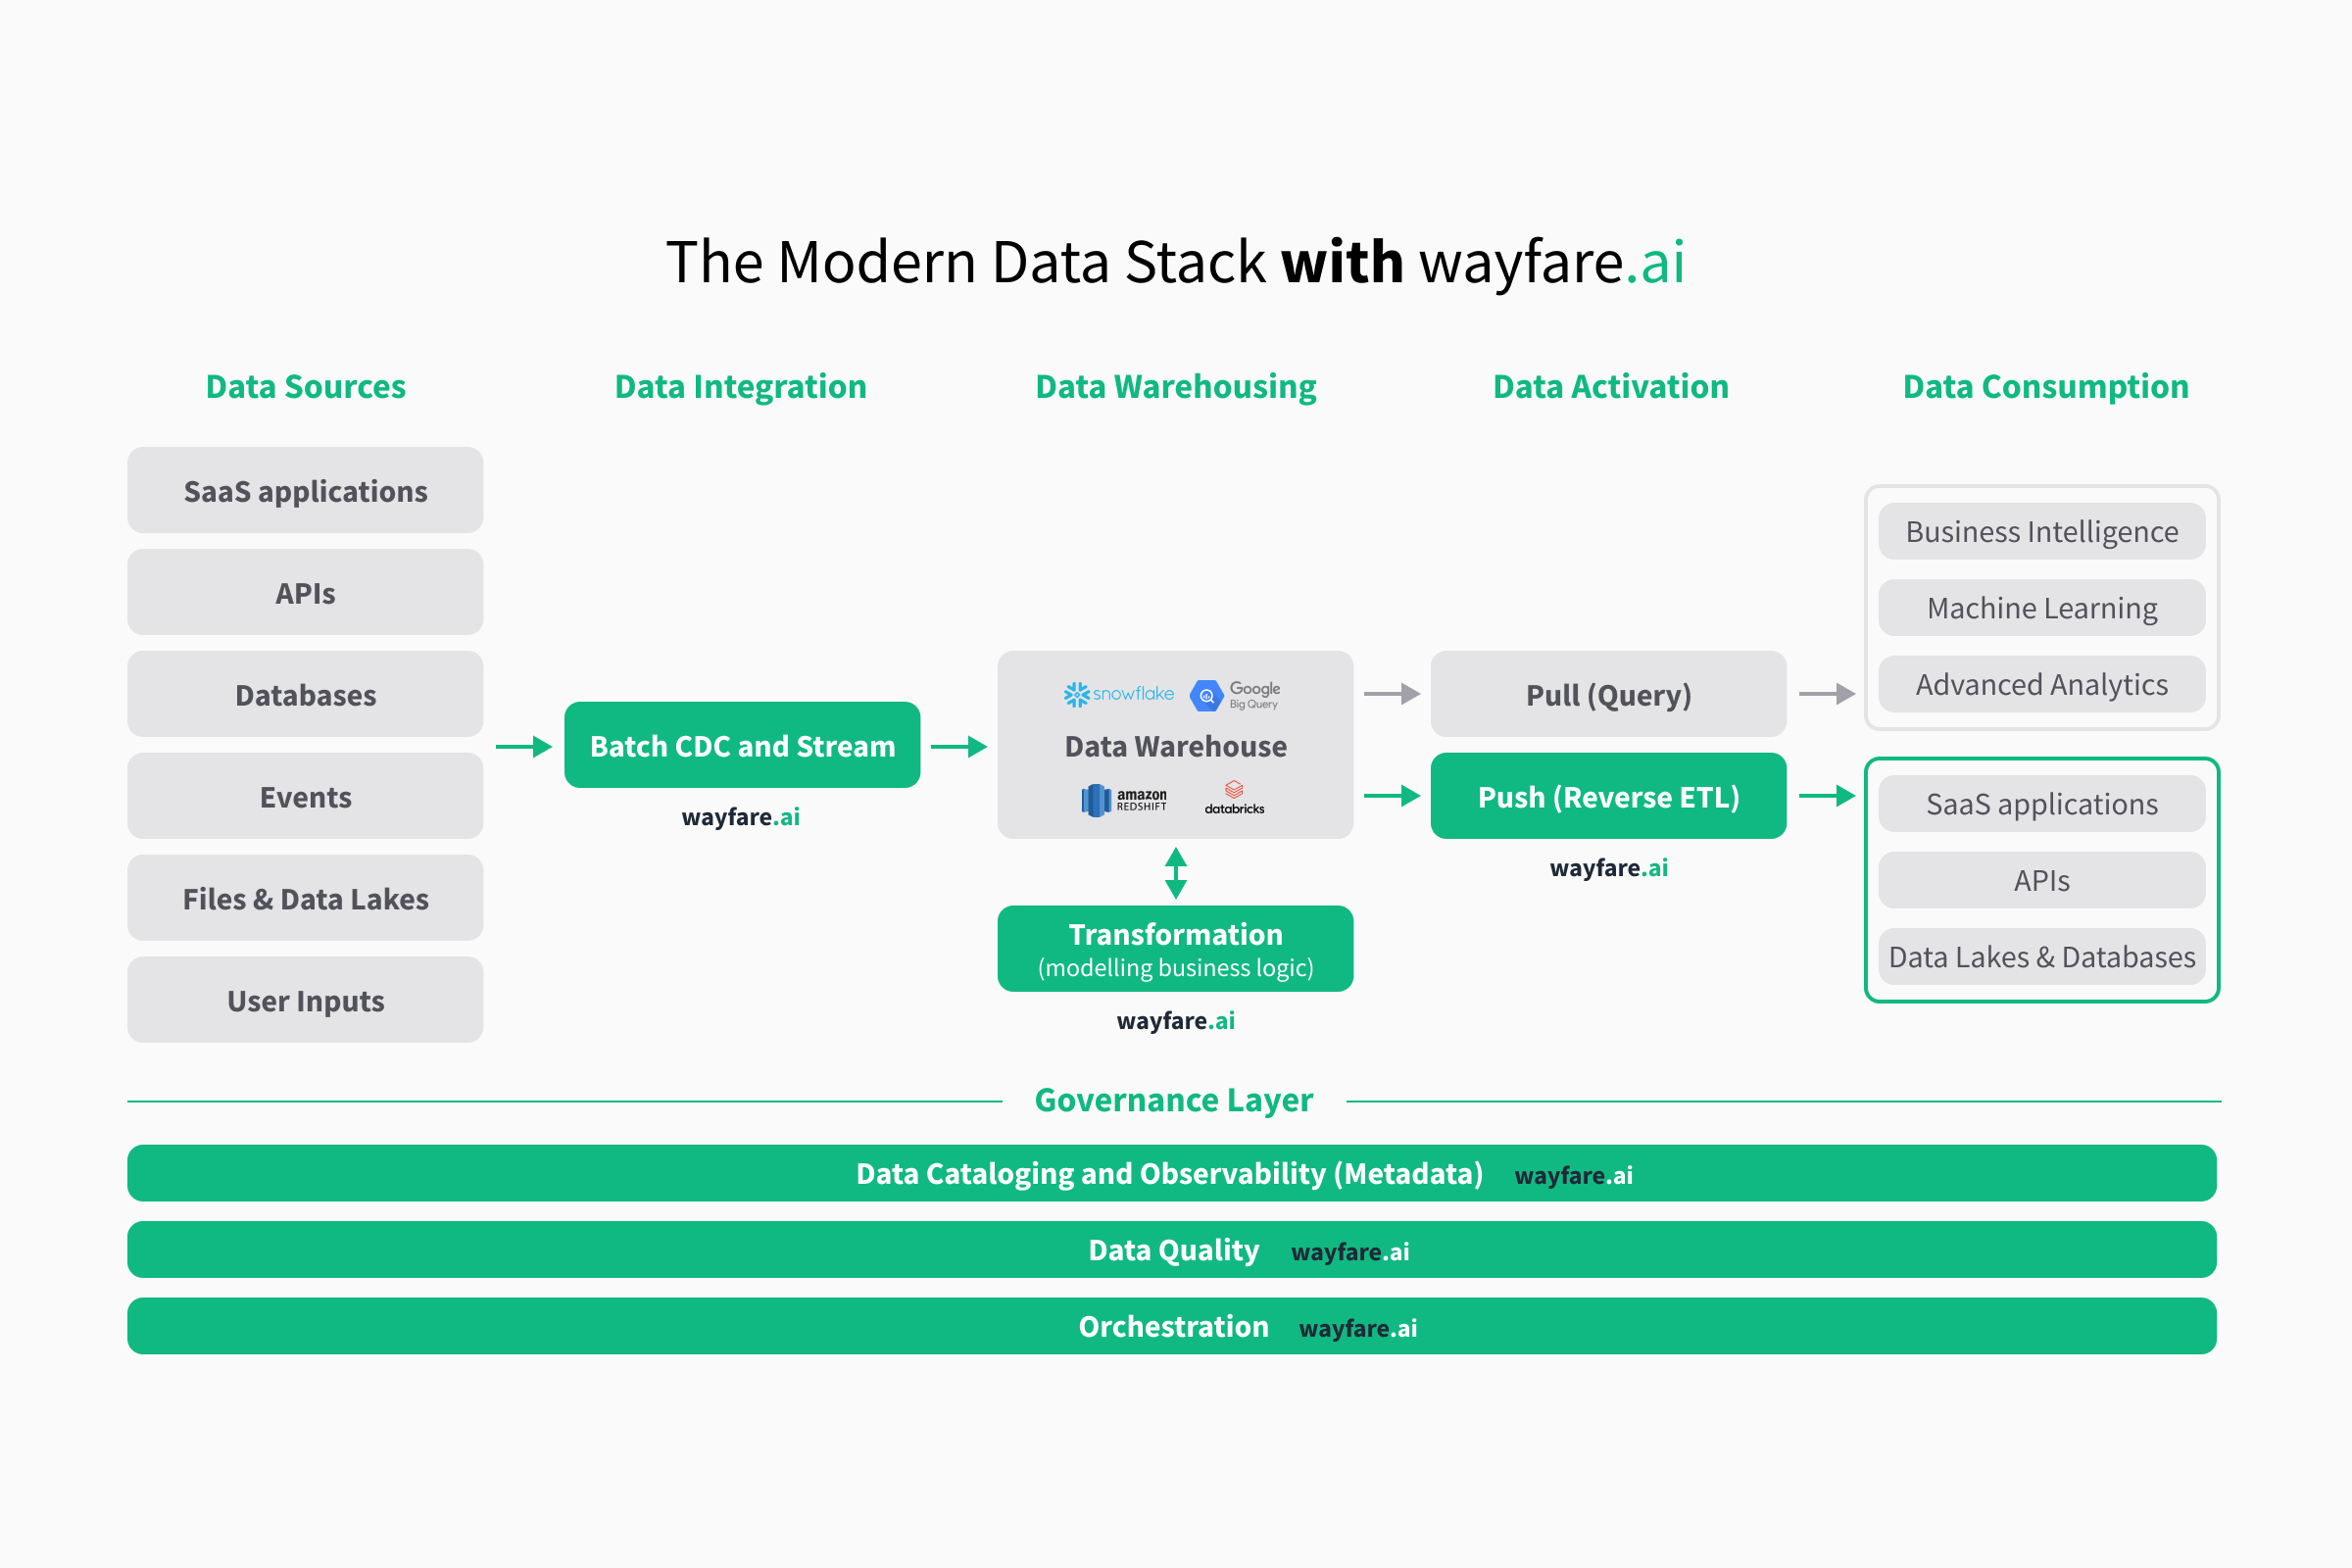
Explore wayfare.ai, the single tool needed to get your Modern Data Stack
With wayfare.ai, you get plug-n-play integrations for all your data sources and data warehouses. We automatically build a data catalogue, and keep your data up-to-date.
No more tool fatigue - let your teams collaborate across functions in a single, familiar setting with wayfare.ai.